
Observability
Runtime logs, distributed traces and metrics for your apps, collected by telemetry agents and stored in ClickHouse.
Observability is in Beta. Logs, traces and route metrics are implemented and available in the dashboard, but setup behaviour varies by deployment shape. Some self-hosted installations may require manual agent configuration. Metrics are also available through Monitoring and Swarm Monitoring.
Observability brings the three telemetry signals - logs, traces and metrics - into one place so you can answer "what just happened?" without leaving Skitflow or shipping your data to a third party.
The three signals
- Runtime logs - structured logs streamed from containers as they happen, searchable and kept for as long as your retention allows.
- Distributed traces - a request followed across services, so you can see where time is spent and which hop failed.
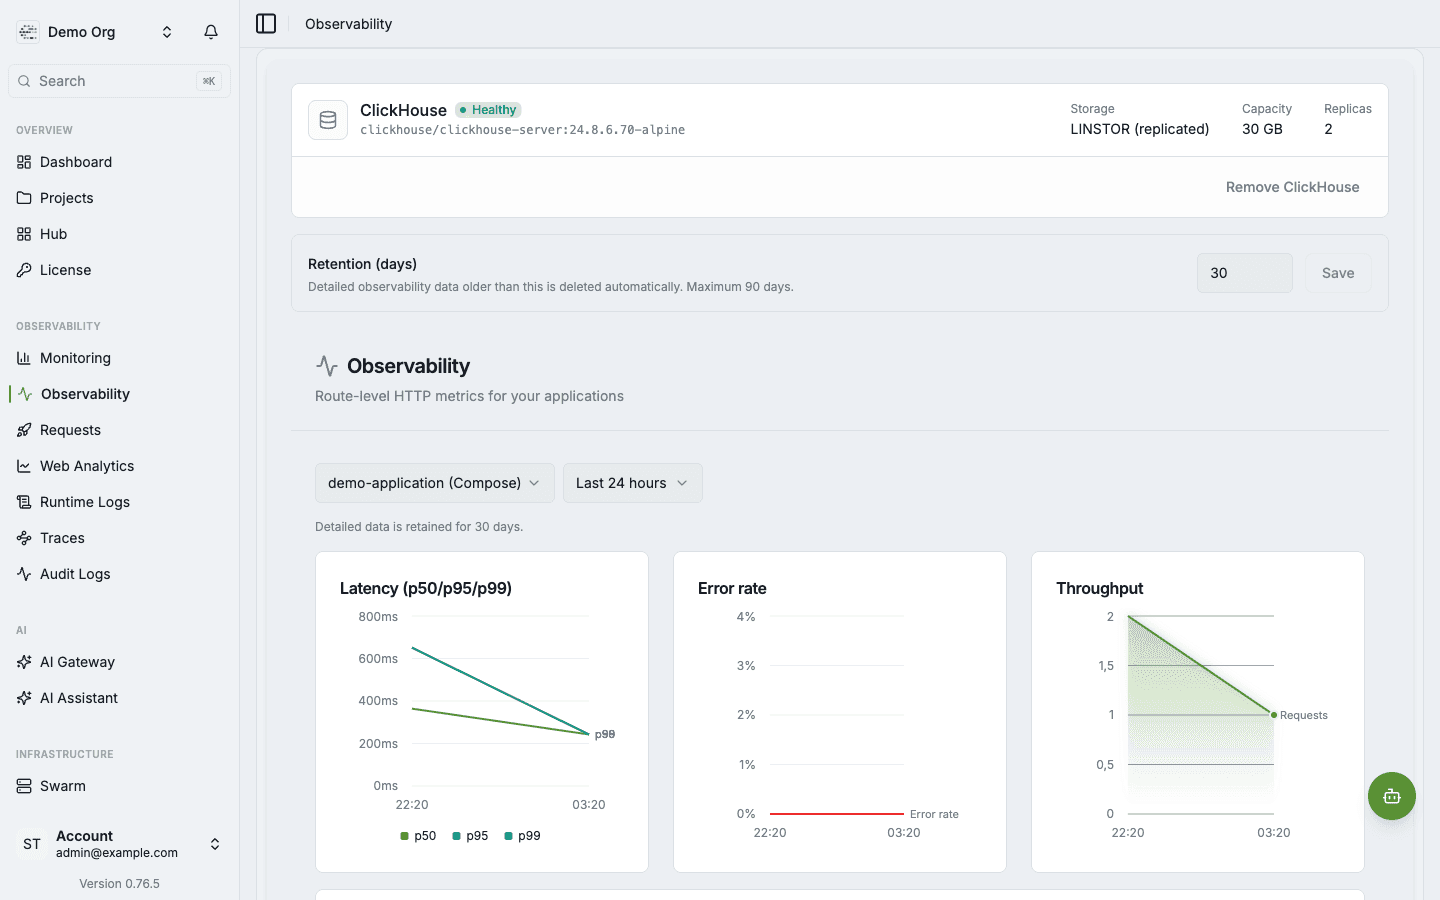
- Route metrics - latency percentiles, error rate, and throughput for application routes.
How it fits together
The pipeline has three stages:
- Telemetry agents run next to workloads and collect logs, traces, and metrics over OpenTelemetry.
- ClickHouse stores the signals in a columnar database built for high-volume observability data.
- Consumers read from that store: dashboards for humans and the AI Assistant, which can use observability context for diagnostics and proposal-based operations.
Enabling Observability
Open Observability in the dashboard. When entitlement and deployment shape allow it, Skitflow provisions ClickHouse and the telemetry pipeline.
Set retention in days. Longer retention gives more history, but it also consumes more ClickHouse storage.
In some self-hosted deployment shapes, ingest token wiring may require manual configuration. If logs or traces do not appear after enabling, check the agent connection and token in the observability settings.
Relationship to Monitoring
Observability builds on the monitoring stack rather than replacing it:
- Monitoring tracks server and container resource usage and alert thresholds.
- Swarm Monitoring shows cluster topology, node health, and service placement.
- Observability adds route metrics, logs, traces, retention, and ClickHouse-backed querying.
Privacy
Agents run beside your workloads and write into ClickHouse. In self-hosted deployments, telemetry stays on infrastructure you own. In cloud deployments, telemetry is sent to the Skitflow cloud control plane.