
Swarm Monitoring
Visualize your Docker Swarm cluster with a live service map and per-container metrics.
When you run Skitflow across multiple servers as a Docker Swarm cluster, Swarm Monitoring gives you a cluster-wide view of where services run and how containers behave, without wiring up an external monitoring stack first.
Swarm Monitoring is self-hosted only — the /dashboard/swarm page is unavailable on Skitflow Cloud.
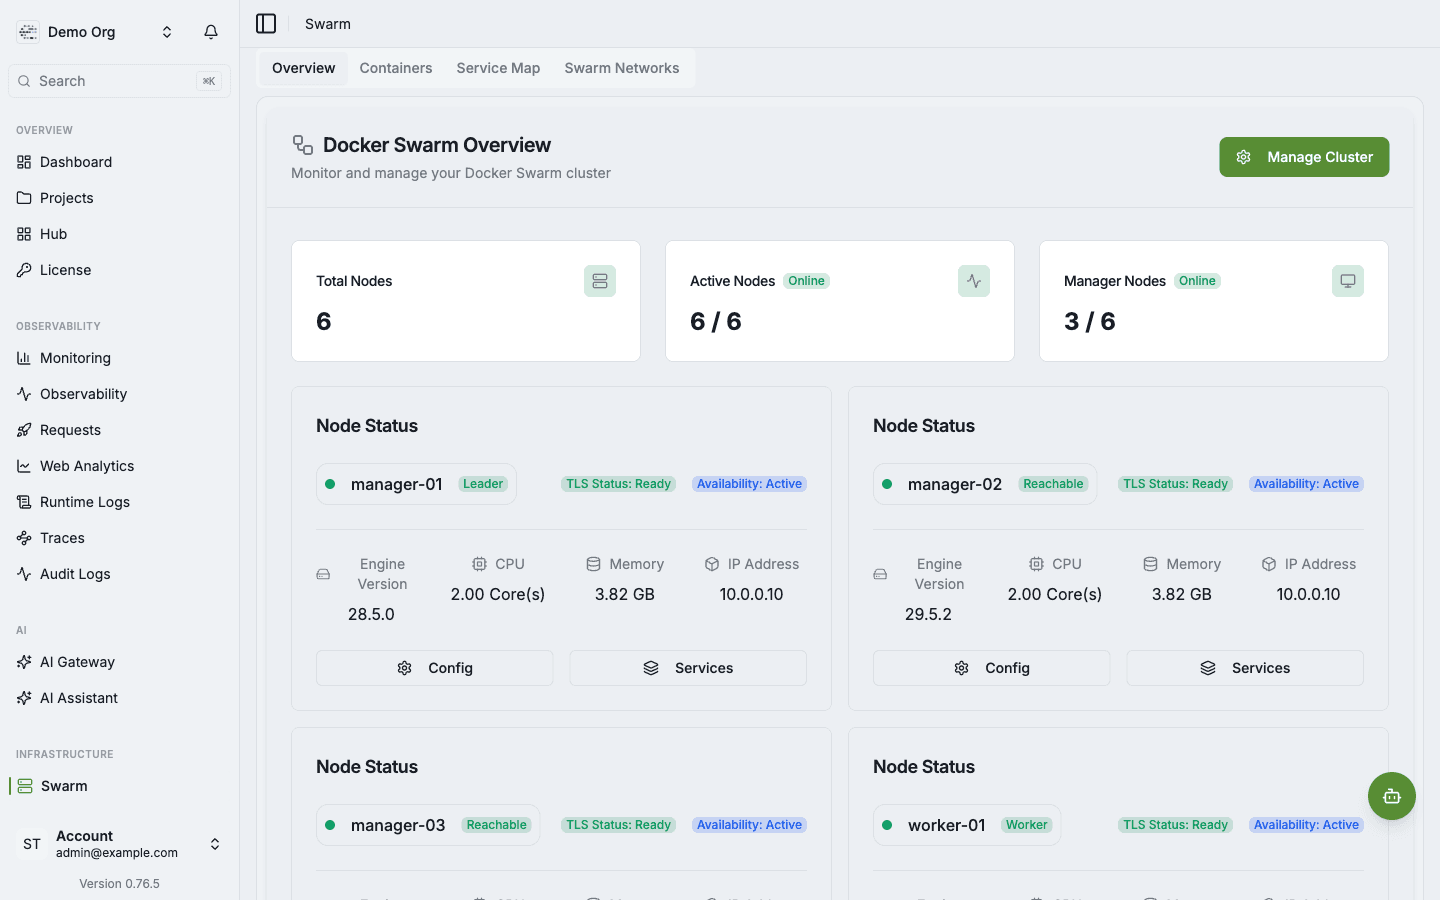
Swarm overview
The overview shows the cluster health baseline:
- Total, active, and manager node counts.
- Manager or worker role per node.
- TLS readiness and scheduling availability.
- Engine version, CPU, memory, and node IP.
- Shortcuts to node configuration and services.
Use it first when a deployment is slow, a node disappears, or a service is not reaching the expected replica count.
Service map
The Service Map tab shows how services, stacks, and overlay networks relate to each other. It helps answer questions such as:
- Which services share an overlay network?
- Which stack owns this service?
- Which services are connected to Traefik and exposed to the internet?
- Is a failing service isolated, or does it sit in the path of other workloads?
The map is topology, not packet capture. A shared overlay network means the services can potentially reach each other, not that they are actively sending traffic right now.
Container metrics
The Containers tab always shows live docker stats for containers running
on the manager node. It also hosts the monitoring activation card described
below — enabling monitoring is what unlocks metrics for containers on worker
nodes and adds per-node agent health cards to this tab.
Use it to spot overloaded nodes, containers that restart frequently, or a service consuming more resources than expected.
Enabling monitoring
Monitoring deploys a small agent stack attached to a manager node, which pushes
per-node container samples so worker-node containers show metrics too (the
manager-only docker stats call can't see them). When you enable it you choose:
- Manager server - the Swarm manager where the monitoring stack is deployed (defaults to the local manager, i.e. the host Skitflow itself runs on).
- Network - the Docker network used to reach services (defaults to
skitflow-network).
You can check whether monitoring is active and disable it again at any time, both from the same card on the Containers tab.
For HTTP route metrics, logs, and traces, use Observability. For node/container resource thresholds, use Monitoring.
Related
- Cluster - set up and scale a Docker Swarm cluster.
- Multi Server - manage remote servers.
- Observability - route metrics, logs, traces, and ClickHouse retention.