Server Refresh Rate: Determines how frequently the server metrics are collected (default: 60 seconds). Lower values provide more accurate metrics but increase server load.
Container Refresh Rate: Sets the frequency for container metric collection (default: 60 seconds). Similar to server refresh rate, lower values mean more precise data but higher resource usage.
If you have configured notifications with Server Threshold properties, metric alerts will be sent to your enabled notification providers, the notifications will sent only if the threshold is exceeded based on the Server itself not individual services.
Make sure port 4500 is open on your server to allow proper communication of monitoring metrics. This is essential for the monitoring system to function correctly.
If you have errors like failed to fetch metrics, or no data available, just give it a few minutes and check again, this is normal, the server needs to collect data first.
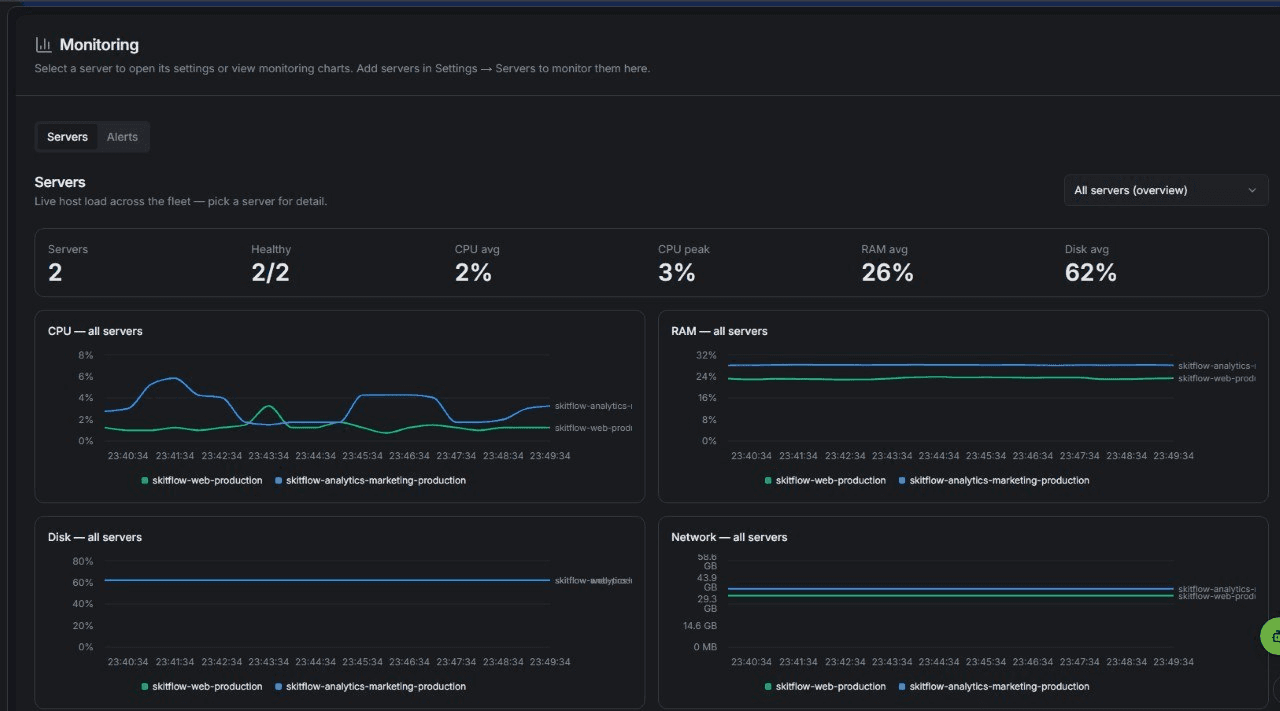
Once monitoring is enabled, the Monitoring dashboard shows an overview of your fleet: server count and health, average CPU, RAM, and disk usage, plus per-server charts for CPU, RAM, disk, and network: